


- தமிழ்
- ENGLSIH
- Video
Power BI இன் முக்கிய அம்சங்கள்:
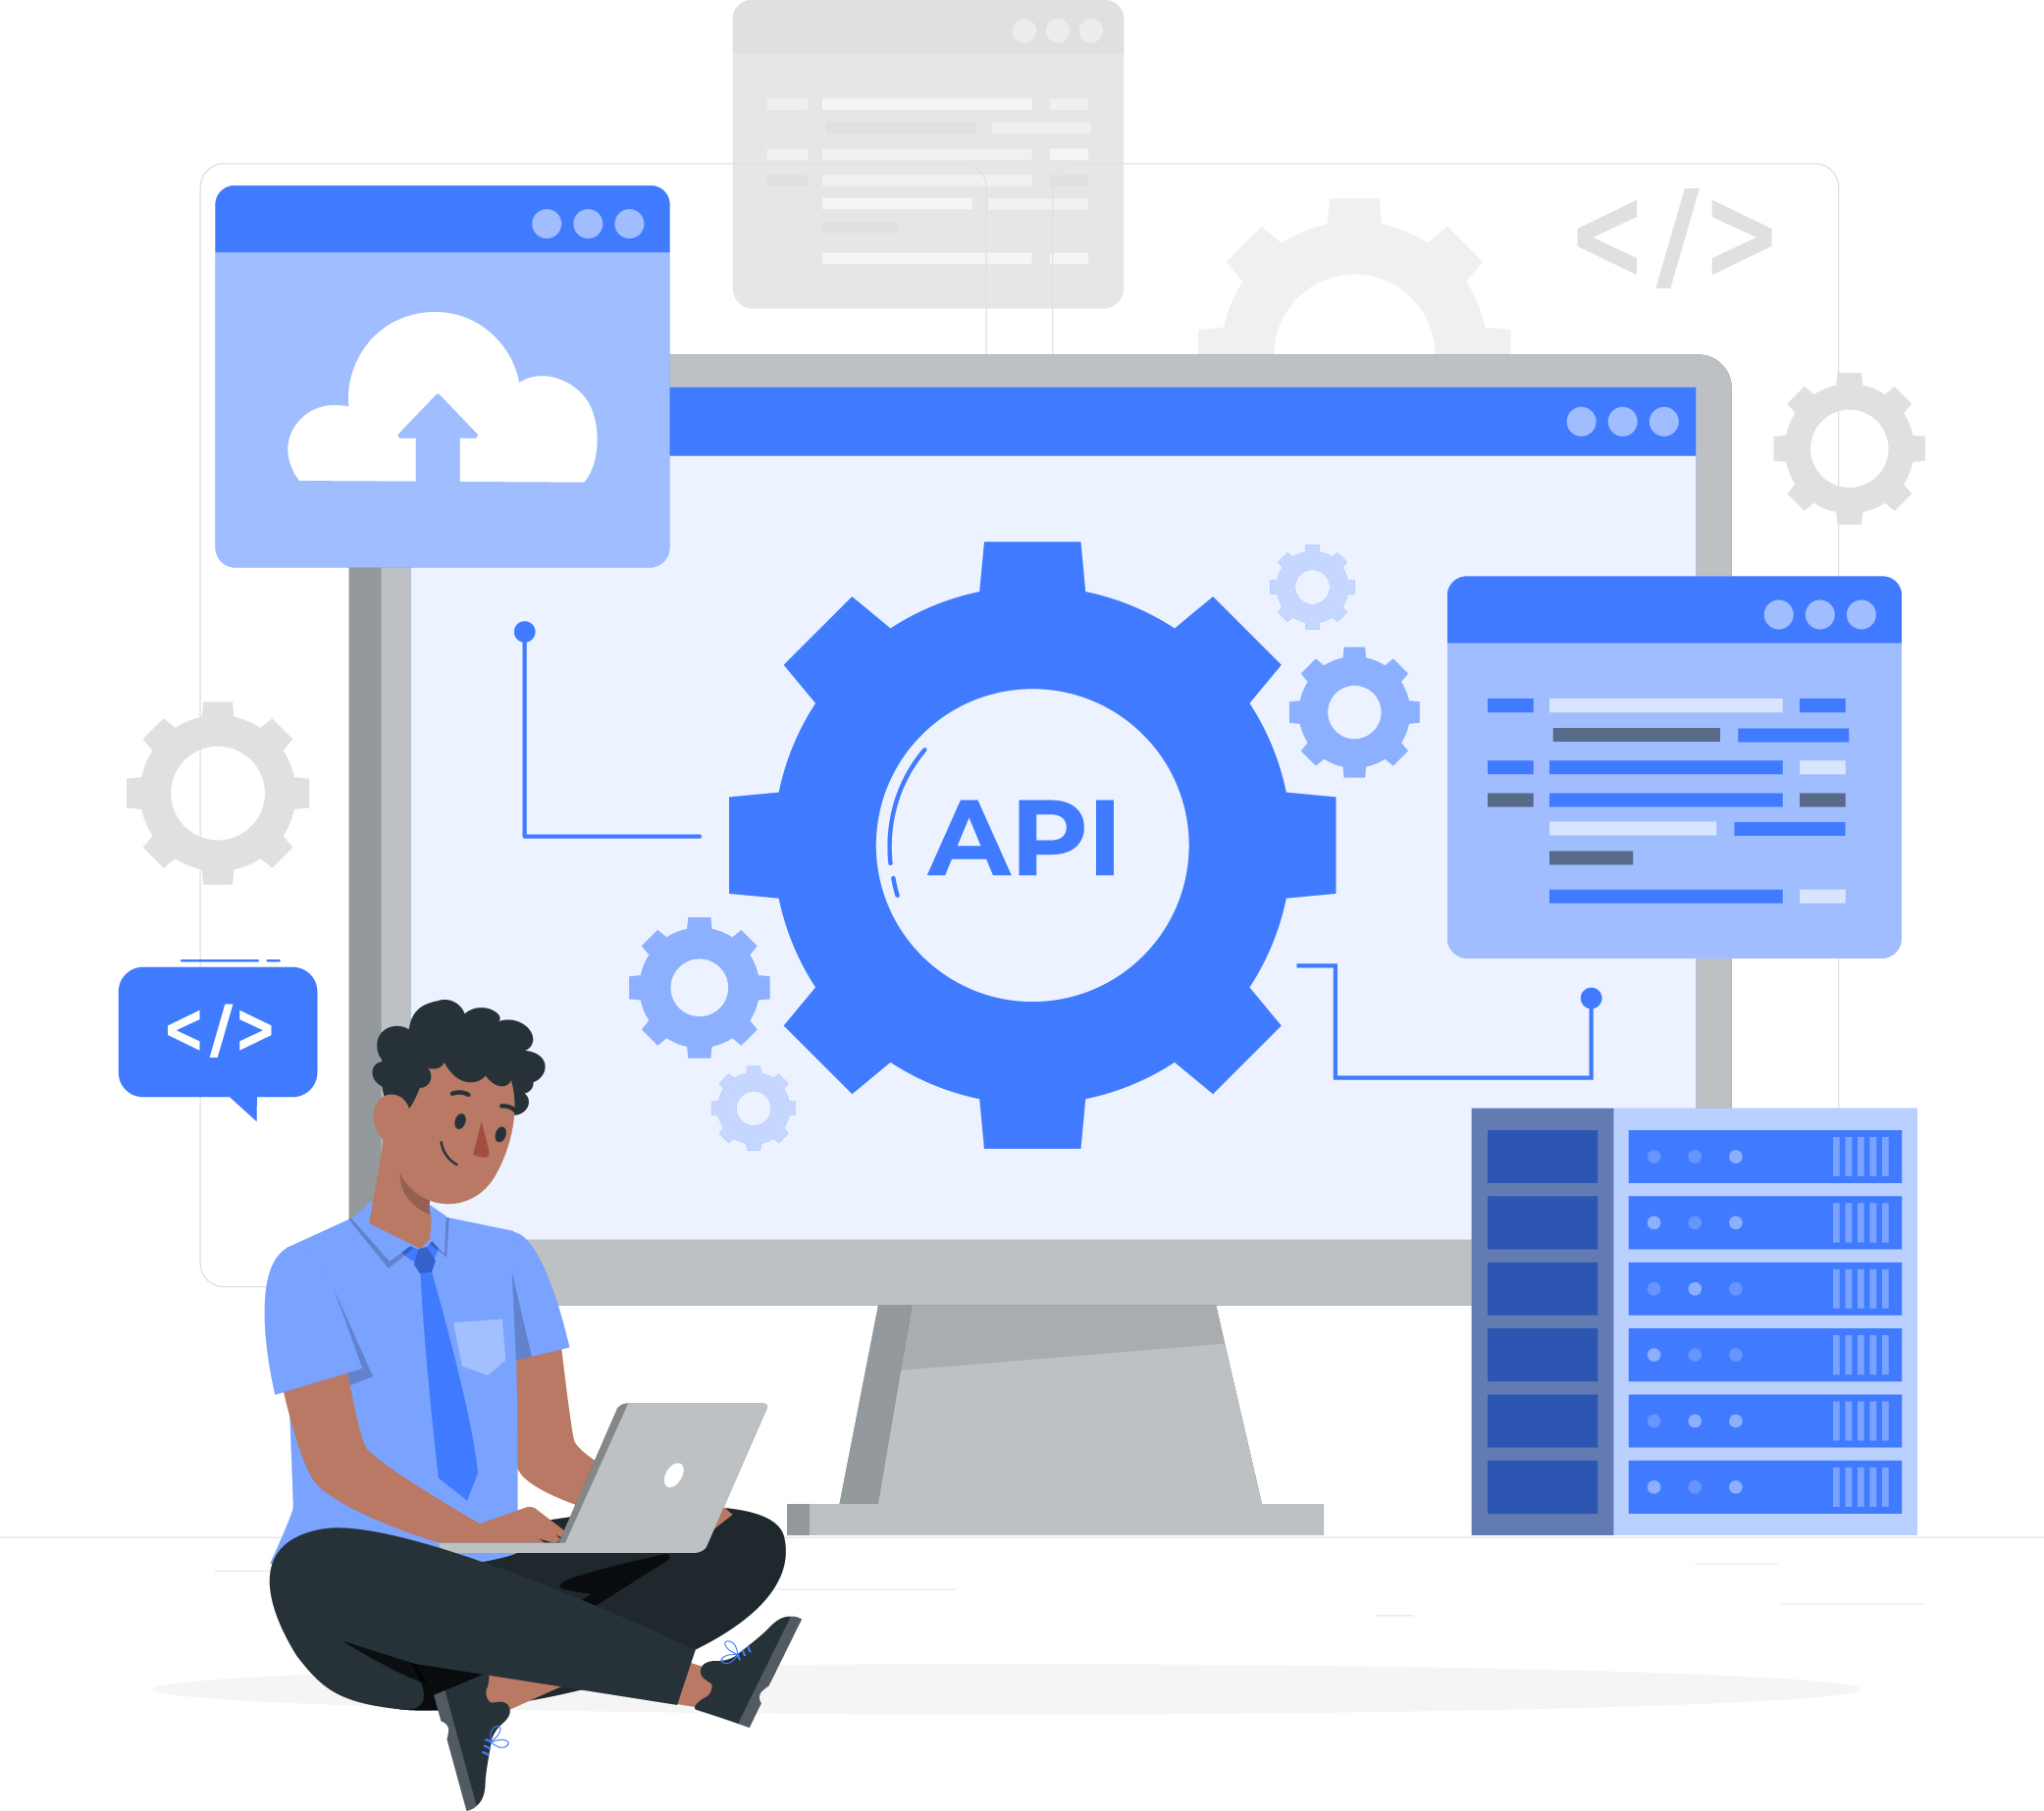
- தரவு இணைப்பு (Data Connectivity): Excel, SQL Server, Google Sheets, APIs போன்ற பல்வேறு தரவு மூலங்களுடன் இணைக்க முடியும்.
- தரவு மாற்றம் (Data Transformation): Power Query பயன்படுத்தி Raw Data-ஐ சுத்தப்படுத்தி ஒழுங்குபடுத்தலாம்.
- காட்சிப்படுத்தல் (Visualization): Interactive Charts, Graphs, Dashboards உருவாக்க முடியும்.
- பகிர்வு & ஒத்துழைப்பு (Sharing & Collaboration): Reports-ஐ Power BI Service மூலம் Online-ல் பகிரலாம் அல்லது Apps/Websites-இல் Embed செய்யலாம்.
- AI & Insights: உள்ளமைக்கப்பட்ட AI Tools மூலம் Trends-ஐ கண்டறிந்து எதிர்கால முடிவுகளை கணிக்க முடியும்.
உதாரண பயன்பாடு:
உங்களிடம் Excel-ல் Sales Data உள்ளது என்று வைத்துக்கொள்வோம்.
Power BI மூலம் நீங்கள்:
- எந்த மாதத்தில் அதிக விற்பனை நடந்தது என்பதை பார்க்கலாம்,
- எந்த பொருள் அதிகம் விற்பனையாகிறது என்பதை அறியலாம்,
- எந்த பகுதி குறைவாக செயல்படுகிறது என்பதை கண்டறியலாம்,
இவை அனைத்தையும் ஒரே Visual Dashboard-ல் காண முடியும்.
சுருக்கமாக:
Power BI = தரவு + காட்சிப்படுத்தல் + பகுப்பாய்வு → சிறந்த முடிவுகள்
Key Features of Power BI:
- Data Connectivity: Connects to multiple data sources like Excel, SQL Server, Google Sheets, APIs, etc.
- Data Transformation: Cleans and organizes raw data using Power Query.
- Visualization: Creates interactive charts, graphs, and dashboards.
- Sharing & Collaboration: Share reports online through Power BI Service or embed them in apps/websites.
- AI & Insights: Uses built-in AI tools to detect trends and predict outcomes.
Example Use Case:
Suppose you have sales data in Excel —
Power BI can help you:
- See which month had the highest sales,
- Which product sells best,
- Which region performs poorly,
all in a single visual dashboard.
In short:
Power BI = Data + Visualization + Insights → Smart Decisions
HTML5 Audio Player
Welcome to the amazing world of our WordPress plugin, HTML5 Audio Player! This plugin is designed to enhance your website’s functionality and provide a seamless user experience. With its intuitive interface and powerful features, you can easily manage your content and customize your site to your liking.
HTML5 Audio Player offers a variety of tools to help you optimize your site for search engines, improve your site’s performance, and engage your audience. Whether you’re a beginner or an experienced developer, you’ll find HTML5 Audio Player easy to use and highly effective.
Experience the difference with HTML5 Audio Player and take your website to the next level. Try it out today and see the results for yourself!